| Introduction |
| Definitions and Basic Concepts |
| Phase Equilibrium and Binary Isomorphous |
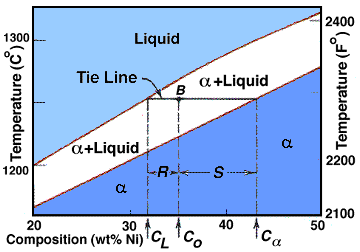
| The Lever Rule |
| Eutectic Phase Diagrams |
| Gibbs Phase Rule |
| Intermediate Phases |
| The Writers and their Contracts |
Since the earliest use of phase diagrams, scientists and engineers have found them extremely helpful in describing the various forms a certain material can take. By examining a phase diagram one can gain some understanding into mechanical properties.
You may find that the analytical and concepts section of this web presentation closely parallels Chapter 9 of Callister's Materials Science and Engineering:An Introduction.This is because the basic premise of this page is to reinforce learned concepts while offering sections of more depth and knowledge. Many of these sections are referenced with hypertext links, which are written in blue and underlined. Links are also provided to related material such as experiments and applications. Comments and suggestions are always welcome, and my address is provided at the bottom of the document
Let's begin by using basic concepts and definitions to understand the phase digram. Callister defines phase as "a homogeneous portion of a system that has uniform physical and chemical characteristics." A system may refer to a specific body of a material under investigation or it may relate to the series of possible alloys consisting of the same components. If more than one phase is present in a system each will have its own properties. A phase can refer to a chemical or physical difference. However, both differences do not neccessarily have to exist. For instance, water and ice are considered separte phases though their chemical compositions are the same. Also, a component with two separate crystal structures can be considered to have two phases. A component is either a pure metal or a compound of which a system is composed.
When a homogeneous system is described, one is usually refering to the fact that only one phase is present in the system. A heterogeneous system is usually refering to a system composed of multiple phases.
Phase diagrams are the primary visualizing tools in materials science because they allow one to predict and interpret changes of a composition of a material from phase to phase. As a result, phase diagrams have been proven to provide an immense understanding of how a material forms microstructures within itself , thus leading to an understanding of its chemical and physical properties. However, there are instances when materials fail to perform to their proposed potential. One can deduce, referring to its phase diagram, what may have happened to the material when it was made, to cause failure. In these instances, one can use thermodynamic relations to go into the phase diagrams and extrapolate data which would not have been available to measure before. Thus, this thermodynamic erudition can lay a foundation to ascertaining the kinetics of processes that take place during phase diagram construction. To understand how concepts such as Gibbs free energy, enthalpy, and equilibrium fit into this picture, look at this brief derivation..
This can be seen graphically by using the free energy, graphing it and using the two tangents. This is the simplest and best way to create a phase diagram.Now that the method of developing a phase diagram has been explored, let us now see how to interpret our diagram. To do this we use tie lines and the lever rule. The lever rule is shown below:
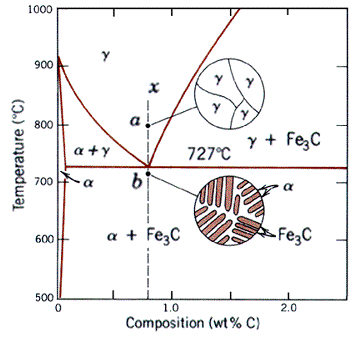
When a binary system deviates from the behavior of ideal solutions, the resulting phase diagram looks like the one shown below. First note that it has all the same regions as a two-phase diagram, namely the solid "alpha" and "beta" phases and liquid, L phase. In addition, there are the alpha+L, beta+L, and alpha+beta regions, resulting from the limited solubility of the two components. Note that here the alpha and beta solid phases are representative of BCC ferrite and Fe3C (cementite or ironcarbide) respectively.
The most important feature of this kind of system is the invariant point, where all three phases are in equilibrium. The fact that this is indeed a point can be verified with the Gibbs phase rule. The composition at which the invariant point appears is called the eutectic composition. The corresponding temperature is refered to as the eutectic temperature. Reactions at this composition are called eutectic reactions (eutectic means easily melted).
Several different types of microstructures arise in a eutectic system. These depend on the composition in question. The simplest case is when the maximum solubility of a compoment at room temperature has not been exceeded. In this case, upon cooling, the resulting microstructure consists simply of grains of the single phase.
Above is an example of eutectic microstructures. They represent from top to bottom globular, acicular and lamellar structures formed under the eutectic reaction.
The second case is when the composition exceeds the solubility limit but does not reach the solubility limit at the eutectic temperature. In this case, upon cooling, the same microstructure as in the previous case results. However, when the temperature reaches the solvus line, the solubility of the alpha phase is exceeded and small grains of the beta phase will start to appear.
The final case of interest involves solidification at the eutectic temperature. As the liquid cools, it hits the eutectic temperature. At that point, solidification initiates and both phases appear. This structure usually consists of alternating layers of the alpha and beta phases. For a more detailed description, see vik's page.
We have so far seen that thermodynamics can play an important role in the construction of phase digrams. The Gibbs phase rule is another example of this and is expressed:
where P is the number of phases present, F is the number of degrees of freedom, C is the number of components in the system, and N is the number of noncompostional variables. Now lets demonstrate how the Gibb's phase rule can be used.
Lets refer to a diagram to make it more clear, for our case we will use the copper-nickel phase diagram, seen below.
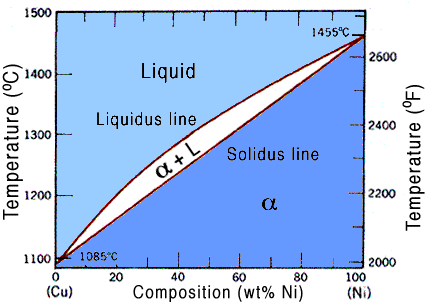
Since pressure is constant, as it usually is, we have only one parameter,in other words, N = 1. So we can say that
So far, we have considered diagrams with only two solid phases. Such cases are termed terminal solid solutions. However, other alloy systems often involve intermediate phases, and such systems are named intermediate solid solutions. One example is the ---Cu-Zn--- system, which contains five peritectic points.
For some sytems, instead of an intermediate phase, an intermetallic compound of specific composition forms. One example is the Mg2Pb compound that occurs at 19%wt Mg and 81%wt Pb. These compound have to be represented on the phase diagram as a vertical line, since the composition is a specific value.
Another interesting reaction that occurs for some systems is the peritectic reaction. This involves one solid phase transforming into another phase plus a liquid phase upon heating.
This concludes the analytical section of phase diagrams. With these basic tools we can say quite alot about a material's properties. These techniques are used everyday by students of Materials Science and Engineering and professional scientists. To learn more about phase diagrams and how they are used please feel free to visit the other sections of this web presentation.
http://www.eng.vt.edu/eng/materials/classes/MSE2094_NoteBook/
96ClassProj/analytic/frontan.html