| Introduction |
| Factors Affecting Solubility |
| Eutectic Reactions |
| Peritectic Reactions |
| Limited Solubility |
| Monotectic Reactions |
| Synectic Reactions |
| Solid State Reactions |
This section discusses what happens in the unfortunate case that our two components do not posses complete solubility. Actually, life among phase diagrams would be rather dull if all we had was complete solubility. Fortunately, there is quite a smorgasbord of phase transitions out there to delight the metallurgist connoisseur. Yet before we detenebrate the mysteries of peritectic reactions, evince the silent beauty of the monotectic diagram, there are a few apposite points to discuss. So pay attention, for there shall be no sclaffing, no desultory drivel, but merely concise expiscation into the nature of limited solubility. (Note: most of this information comes from Prince, A. Alloy Phase Equilibria. Elsevier Publishing, Amsterdam :1966. ) (All the phase diagrams used here come from that book)
There are four major factors that determine whether a solid solution will indeed arise between two metals. The foremost is the atomic size factor. If a foreign atom is substituted into a lattice, there will naturally be a distortion of the lattice. This will cause the formation of a new phase. Well, more closely in size this atom is to the lattice atoms, the easier it will be to assimilate. Research has shown that the atomic sizes of the two components have to be within 15% to get complete solubility. However, size compatibility does not entail solubility. There are other forces at work here. The elements have to have similar electrochemical factors. The more electropositive one element and the more electronegative the other, the more there will be a tendency to form an intermetallic compound instead of a solid solution. The third factor of relevance is the relative valency of the two elements. The higher the valency of one component, the more likely will it tend to dissolve in the other component. And finally, the two potential solid solution members need to have the same crystal structure for complete solubility.
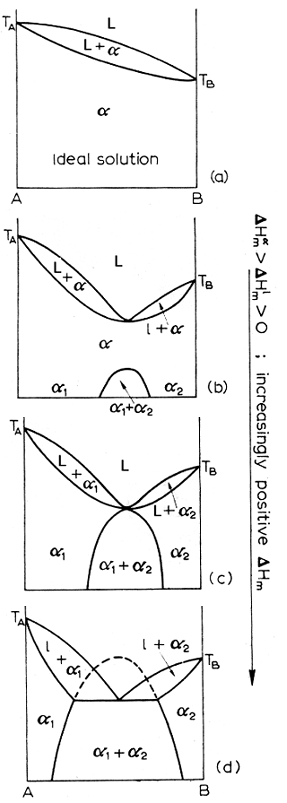
A quantitative method of measuring solubility is to look at dHm, the enthalpy of mixing. The more positive this quantity is, the less ideal the solution. The diagram below shows a progression from ideal to less ideal solutions and what the corresponding diagrams look like as the dHm increases.
After that refreshing meal of metallurgical wisdom, we are ready to look at the most prominent type of phase diagram.
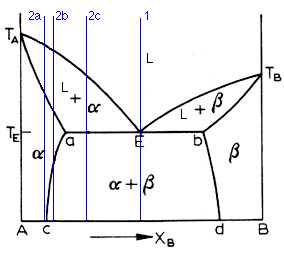
Above is the typical eutectic diagram. At first, it may look formidable, but fear not, for we shall tame the roynish scoundrel. As you can see, we have all the regions common to a complete solubility system. Now, it is common to call the terminal solution on the left side the alpha and the one on the right the beta. And so it shall be. So we have the alpha, the beta, and the liquid phase. Thus the term three-phase equilibria. We also have the alpha + beta, alpha + L, and beta + L. The liquidus line in a binary eutectic is the curve Ta-E-Tb. The solubility curves ac and bd delimit the solid phases (a.k.a. the solvus curves). The solidus curve is the line Ta-a-E-b-Tb. Note that the solubility curves slope inward, in accordance with the fact that solubility increases with temperature.
Now lets consider what happens when a solution of certain composition
cools. The simplest case is that of a compound of eutectic composition,
denoted by line 1 on the diagram. The eutectic reaction occurs at Te, the
eutectic temperature, and is denoted by:
Now, a eutectic mixture will have a characteristic microstructure. These structures are called lamellar, globular, rod and acicular, depending on the appearance of the two phases (see main analytical page). However, this classification is somewhat misleading, since it has been shown that the structure of the eutectic composition is dependent upon the conditions of solidification as well as the effect of impurities in the liquid. The solidification will initiate with the nucleation of one of the phases. This will cause the other phase to be rejected at the interphase of the first phase with the liquid. At some further point, the other phase will begin to nucleate. In the case of a lamellar eutectic, the second phase nucleates on the first phase, thus creating the lamellar growth which give it its name.
The diagram has been repeated above for convenience. This is a friendly page, afterall. Now we come to the case of hypo-eutectic alloys. These are ones whose Xb component is less than the eutectic composition. There are three different cases worth noting, denoted by 2a, 2b, and 2c. Lets look at 2a. This is the same case as for a two-phase system. The solid starts to nucleate when the cooling crosses the liquidus line and when it crosses the solidus line, there is no more liquid. So we get the regular grain structure of a metal. The 2b case is more interesting. It begins in the same way, freezing as an alpha solid solution. When it crosses the ac solvus line, however, the beta phase starts to deposit from the alpha phase. The beta phase can precipitate at the alpha grain boundaries, at certain crystallographic planes of the alpha phase, or around inclusions and dislocations. the final case is illustrated by 2c. Here, upon crossing the liquidus line, the alpha phase begins to deposit. When the composition reaches the eutectic temperature, the remaining liquid undergoes the eutectic reaction. The alpha phase is then present as primary (that fraction present before the eutectic reaction) and as one of the phases in the eutectic mixture.
Hyper-eutectic alloys are ones where the Xb composition is greater than the eutectic composition. They behave in a similar way to hypo-eutectics, the only change being that now the dominant phase is the beta phase. And thats all I have to say about that.
Actually, no its not. One more point will be made. Above is a representation of the evolution of the limiting form of a eutectic diagram. The diagram on the right is an impossibility, since it implies complete immiscibility. it also implies a melting range of Ta to Te for the alpha phase. Thus such a diagram cannot be. The complete immiscibility of two metals does not exist.
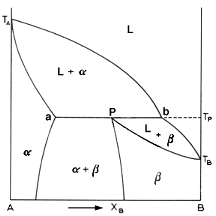
Above is the picture of a typical phase diagram incorporating a peritectic
reaction. We basically have all the same regions as in a eutectic. The only
difference is that there is no eutectic reaction. instead we have a peritectic
reaction:
Let us examine the elusive conundrum of the peritectic reaction. Going down line 1 on the diagram, we cross the liquidus curve Ta-b-Tb. The alpha phase starts to separate and increases in fraction according to line Ta-a. When Tp is reached, the peritectic reaction occurs. When the reaction is completed, all the liquid has been consumed and all the alpha in the solution has been converted to the beta phase. So now we have 100% beta solution. As the solution cools further, the alpha phase begins to precipitate back from the beta phase. Unearthly, would you not say? had the curve Pd been sloping to the left, the solution would remain 100% beta.
Alloys with Xb<P are only interesting for the case a<Xb<P. These alloy undergo the peritectic reaction. As the liquid cools, it forms the alpha phase until it hits Tp. Then all the liquid reacts with some of the alpha solid to form the beta phase. Thus, after the peritectic reaction is complete, consists of the leftover primary alpha phase together with the newly formed beta.
For alloys with Xb>P, the same thing applies. For P<Xb<b, the peritectic reaction occurs. In these cases, there is an excess of the liquid phase over that required to form the necessary amount of beta. That is the only difference.
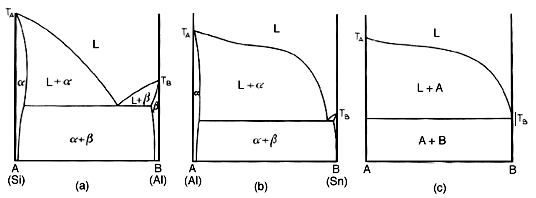
A common type of peritectic diagram is one with an intermediate phase. This intermediate phase has a composition between those of the terminal solutions. It usually as a different crystal structure which differs from the components. Also, there is usually a eutectic reaction between this phase and the beta phase. These phases can be classified into three broad categories:
It may indeed happen that in the liquid phase, we have partial immiscibility. If you ever mixed milk and motor oil, you know what I am talking about. Well, the same thing can happen with metals. Above is the diagram of a progression of the appearance of a phase diagram as the dHm, the enthalpy of mixing of the liquids gets more positive.
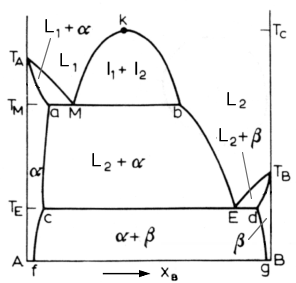
Above is a diagram of a typical system with a monotectic reaction. The monotectic reaction is:
In this reaction, a liquid decomposes into a solid phase and a new liquid phase. Above the monotectic temperature Tm, we have two liquid phases. From the Tm, to Tc, the critical temperature, the two liquids are immiscible and will separate as two layers. Below the monotectic temperature, there is usually a single solid phase in equilibrium with a liquid phase. Examples of this are the Ga-Pb and Ga-Tl systems.
The monotectic alloy goes through point M in the above diagram. At Tm, it undergoes the monotectic reaction. Once again, we see similarities to the eutectic reaction. As the solution passes point M, the alpha phase starts to nucleate. The L2 phase appears as well, dispersed among the alpha matrix. When the solution reaches the Te temperature, the L2 liquid solidifies into the beta phase.
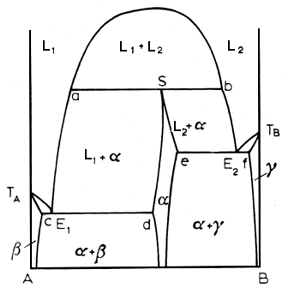
Above, a syntectic reaction lurks within the diagram. This is a rare beast among alloy systems, occurring in systems like K-Zn, Na-Zn, K-Pb, Pb-U and Ca-Cd. The pertinent reaction is:
In a syntectic system, the alpha phase is an intermediate phase formed when the two liquids freeze, for a specified composition, the syntectic composition.
There are three major solid state reactions that arise:
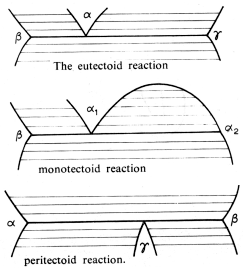
These are exactly as the previously mentioned reactions, except now the liquid phase has been replaced by a solid phase. The only difference is in the kinetics of the reactions, the solid state reactions are slower than their liquid counterparts.
An additional factor must be considered in the free energy calculation. This is the Gstrain, the free energy of straining that occurs as a result of changing crystal structures and lattice parameters. Thus the reaction will occur if -dG.bulk > +dG.interface + +dG.strain.
That completes our tour through the phase equilibria zoo. Yet do not succumb to thanatopsical threnodies, do not sink into lachrymal elegies, for this is not the end. Here's something extra..
http://www.eng.vt.edu/eng/materials/classes/MSE2094_NoteBook/
96ClassProj/analytic/simk.html