If we take the velocity equation for the model and integrate it, then we have have the equation giving the position of an imaginary weightless particle released into the 3D space at a nominated initial position. If we solve that equation using techniques as described under Solving the Model we can follow the trajectory of one such particle. However, this is a stochastic model so we would not expect the trajectory for one particle to be the same as another.
To get an overall view of the behaviour of all trajectories, a program was written to solve the model 1000 times and to trace each trajectory from a point in the middle of the plane at X=0.
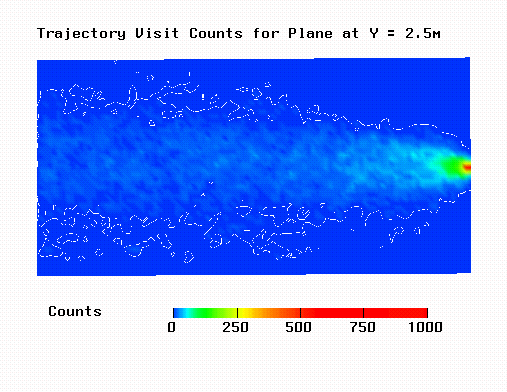
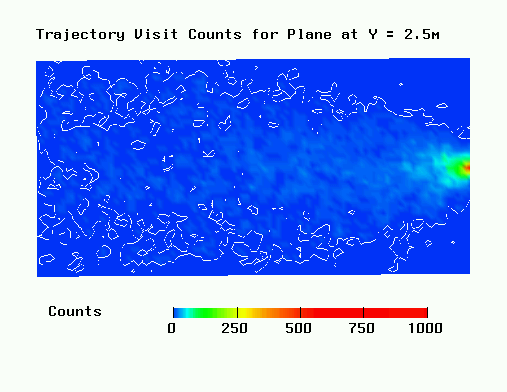
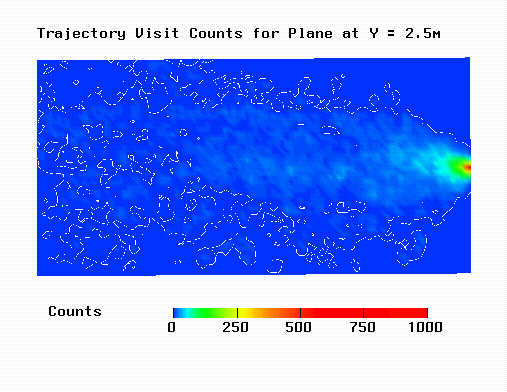
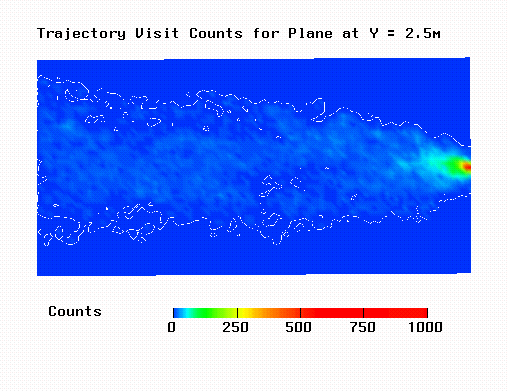
The position of the weightless particle was calculated at the end of each integration time step. The nearest point on a predefined grid was determined and one was added to the "trajectory visit count" associated with that grid point. This was done at every time step for every trajectory simulated. In this way a type of 3D frequency distribution was generated. The simulation of a particular trajectory was terminated when it went outside the volume enclosed by the 3D grid. In the examples below, the grid was 100x50x50 corresponding to dimensions of 10m (X), 5m (Y) and 5m (Z). Counts have been normalised to a maximum of 1000. In the diagrams, X=0 is at the right side and X=10 at the left.
A plot of trajectory visit counts for the base model parameter set is shown below.

Plot of trajectory visit counts for sx=sy=sz=0.1

Contours of trajectory visit counts for ![]() = -0.001052
= -0.001052

Trajectory visit counts for dt = 0.001
