PV-WAVE
STARTING :
The whole application was programmed in
PV-WAVE enviroment. To create the Graphic User Interface (GUI) we
used the integrated WAVE Widgets. In order for someone to run the apllication
he must have the PV-WAVE software package instaled in his computer. To
run the application follow the steps below :
Start first PV-WAVE programm.Then type
at the wave commant prompt :
LOADING THE DATA :
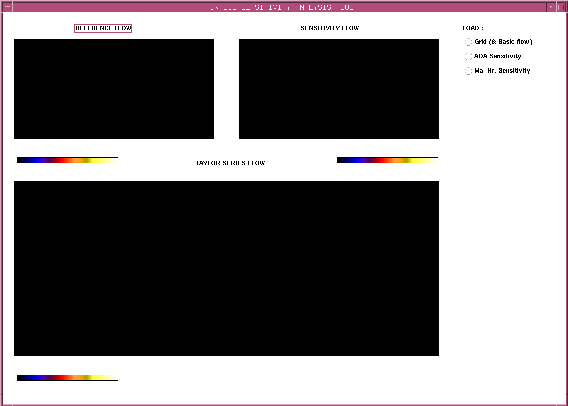
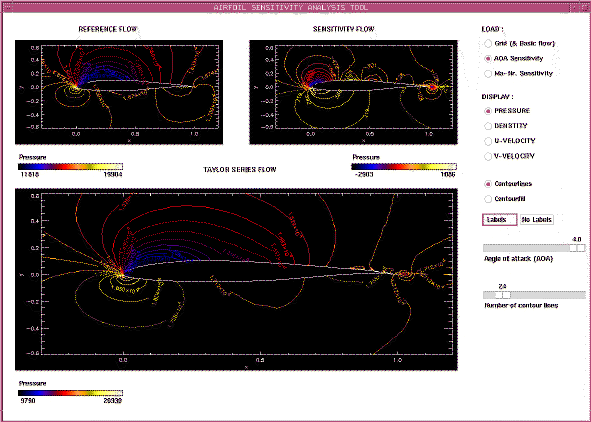
The screen is divided in two parts. In
the left part three display windows appear. The two small windows are used
to visualize the reference flow and the sensitivities. The big window is
used to dispaly the the new calculated flow.
The right part of the screen is used as
the input area of the user. In the begining the user must load the grid
file by using the "load grid" button. He can browse the directories to
find the file he wants to select. Ones the selection is completed
the programm will load the grid data and automaticcally the reference flow
file too. Note that this file has to be in the same directory as the grid
flile and must have the name "q.p3da". Then the user must select the file
that containes the sensitivities by choossing the appropriate button. In
the present time (12/97) only the sensitivieties with respect to the angle
of attack (AoA) where provided.It will be also possible in the future to
load the sensitivities with respect to the Mach (among other sensitivities)
and this is indicated with the third button in this first menu.

DISPLAYING THE DATA :
When the programm is done with loading the sensitivity data the right part of the screen is extented to display new selection buttons and slider bars that will enable the user to visualize the flow.
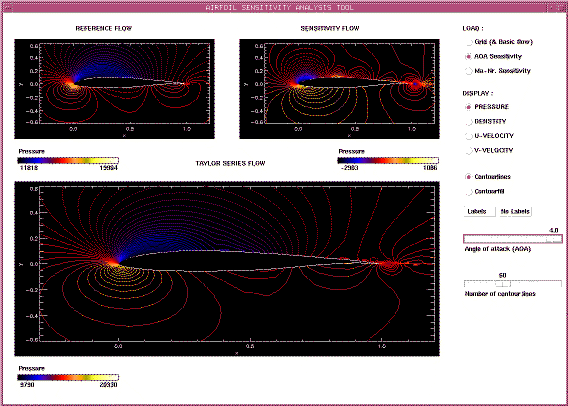
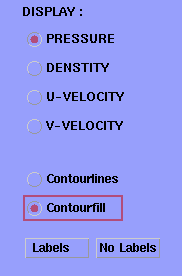
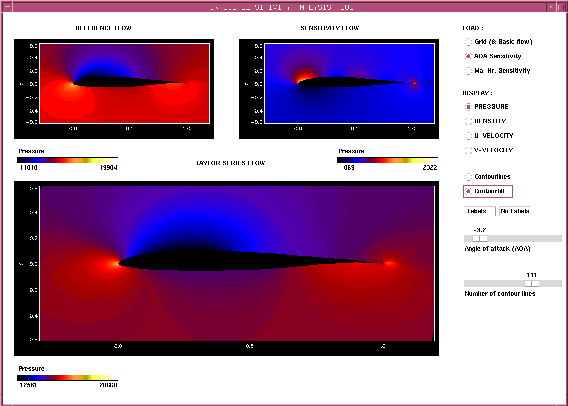
As one can see in the picture bellow the
user can choose to display colored contour lines or filled colored contour
regions, of the four primitive variable of the flow such as pressure, density
and velocities in the x- and y- direction. When displaying contour lines
the user can click the "labels" button to display the values of the
contour lines.
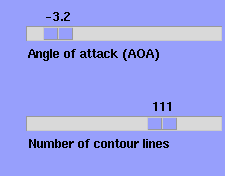
Underneeth the "label" buttons two slider
bars are located. The first slider is used to select a value for the parameter
with respect to whom the sensitivieties are calculated. In the example
here this is the angle of attack. With the second slider the user selects
the nummber of contour lines that are used to visualize the flow.
Below are some hardcopies of the display
for the example data provided here. The first picture shows contour lines
with labels and the second pictures shows contour slices.
QUICKTIME MOVIE
and SGI-MOVIE:
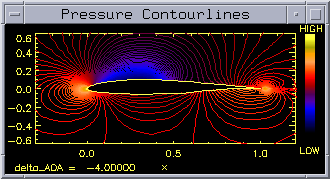
In order to demonstate the change of pressure
in the flow when changing the angle of attck from -4 degrees to +4 degrees
we created a Quicktime and a SGI movie.

DOWNLOADING :
We provide the interested "surfer" the oportunity to download the PV-WAVE procedure files along with the data files.
Download a Ziped and tared file : data.tar.Z
(3.9 MB)
Download the PV-WAVE Procedure file :
airfoilSE.pro
(39 KB)
Download the grid file : grid.p3da
(2.8 MB)
Download the reference flow file : q.p3da
(4.6 MB)
Download the sensitivity file : q_SE.p3da
(4.5 MB)
Download the file that craeted the animation
images : anim1.pro
(6KB)
Downloda the files that plot the grid
: plotgrid.pro
(6KB)
This application will develop further in
the future so it will include futures discussed in Recommendation/Conclusions.
If you want an updated version of the programm please contact Dipl.
Ing. Iossif Mugtussidis or Dimitrios
G. Stamos .