</COMMENT>
 

Sine Wave Demo

The effectiveness of this project hinged on the ability to display data from mechanics problem in a way that visually represented the problem.  There was a considerable amount of learning involved, and a simple example was chosen to begin programming in Java.  The first program that was chosen was a simple sine wave generator.  The purpose was to learn how to draw a two-dimensional plot to the screen, and how to accept user input.  The interface was made to look like an oscilloscope, and can be seen in figure 1, below.  The user can enter values for the amplitude, frequency, and offset, and a sine wave is drawn to the screen.  The user can also change the volts per division in the vertical direction, and the seconds per division in the horizontal direction.  When the user applies the changes, the sine wave changes accordingly.  The window in this example can be resized, however, the wave remains the same size on the screen.  The equation that is drawn on the screen is,

 
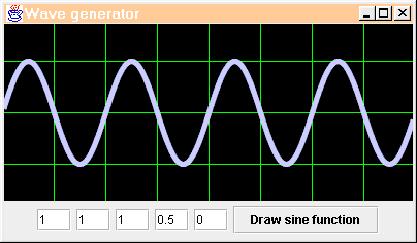
where a is the amplitude in volts,  f is the frequency in Hz, and yoffset is the average distance from the y-axis in Volts.  The amplitude of the equation on the screen can be increased or decreased by varying the amplitude, or the volts per division.  Obviously, as the number of volts per division is increased, the height of the wave on the screen decreases for the same amplitude.


Figure 1: Sine Wave Generator