Analysis of simulated C-Scans in Steel pins

Sam Parikh (ESM) and Fernando Das Neves (Computer Science)


General Problem:

Ultrasonic C-scans scans ares one of the methods available to analyze the state of steel pins in bridges.A C-Scan is the plotting of a collection of gated amplitudes of ultrasonic A-Scan signals. An A-Scan is the amplitude of the signal versus time/depth, given that in steel pines the time is directly proportional to the speed of sound.

In the field, when C-Scans are done for special cases, the C-Scans do not give us geometric description or geometric placement or crack/ware grove within the solid steel pins. Since the speed of sound if constant within a homogeneous steel pin the time can be directly related to the depth.

Image of a C-Scan
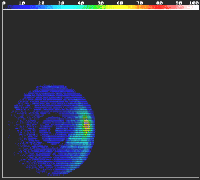
Image of a C-Scan of a Steel pin, showing a crack. The scale above indicates amplitude.

Plotting of C-Scans is done in color-directly proportional (linear) to the flaw amplitude compared to a given amplitude within a certain range. The problem with analysis this plotting to extract flaw information (depth dimension) within the pin is that due to the sound field propagating in a conical zone (the beam spread) a reflection can occur anywhere within that zone. Even if the beam is picked by the probe, that does no put the flaw that cause the reflection immediately beneath the probe. The current analysis of C-Scans of to relate the crack size and dimension to what appears on the C-Scan, and to put it in a parallel, cross-section plane to the crack that was pictured in the C-Scan.

Scope of this project:

The scope of this project is to use a ray-trace model to get A-Scans after inserting a mathematical model of cracks within a model of a solid steel pin. The A-Scans will then be reconstructed into C-Scans and will show what that particular crack would look like on the C-Scan image.. We take data generated by the mathematical model inputting various cracks at different depths and geometric dimensions, and to compare the C-Scan images generated. We also would like to try out different beam spreads and to see whether that makes any worthwhile difference.

Proposal:

We will create a program that implements the mathematical model and will use AVS to manipulate the data created by the model. We will write new AVS modules to manipulate the scatter data generated by the program. A further extension of the project is to analyze the 3D dataset by displaying it on the CAVE via NCSA's Crumbs. We will write a module that allows to ouput the volumetric data from AVS directly in Crumbs format.


Sam Parikh (ESM) and Fernando Das Neves (Computer Science)