home:tools:capVTE sitemap

capVTE

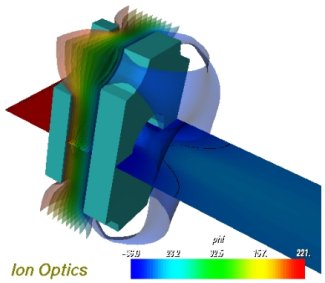
The CAP Lab Virtual Testing Environment, or capVTE, © 2003 CAP Lab, is a visualization software currently being developed at Virginia Tech by me with the support of the members of the CAP Lab. The goal of this development is to generate a comprehensive package allowing for a simple-to-use visualization of three dimensional data produced by computer plasma simulation. The program allows the user to load in the 3D dataset, and visualize the grid parameters using tools such as isosurface and cutting planes. The image on the left illustrates this feature. The geometry of ion optics is embedded inside a computational grid, and isosurfaces with a cutting plane are used to show the distribution of the electric potential, f.

capVTE was designed with the end user in mind, and thus it uses a very simple to use GUI interface. The user can navigate through the data in real time, by using the mouse to translate and rotate the camera. The input dataset consists of several ASCII files, which can be interconnected using an INSERT command. Thus, it is possible to generate a library of standard geometries, for instance, and link in the desired files by altering the list of files to include. Since data visualization has little significance if the results cannot be shared with colleagues, capVTE allows the user to save the results as a flat .jpg file, or as a 3D Inventor file that can be loaded into the CAVE. Results can also be posted online by saving the result as an VRML file. Several plugins and stand alone programs, such as VRWeb can be downloaded freely from the Internet to enable the playback of VRML files.

capVTE uses Kitware's VTK for the onscreen rendering. The GUI is designed using Trolltech's QT. Since VTK was not designed to render directly into a QT window, Jan Stifter's vtkandqt is also used. Both VTK and QT are available for a variety of platforms, allowing multi-platform versions of capVTE to be created by merely linking in the appropriate libraries.

capVTE supports multiple geometries, defined by their node positions and a connectivity list. Although this is feature is not yet fully integrated, the computational module will obtain its geometry boundary conditions from a capVTE geometry file. In the past, the geometries were generated using MSC Patran, however, this had a tendency of being a tedious process due to Patran's limited drawing capabilities. Currently, a VRML to VTE converter is being developed. Since most CAD programs allow an export to VRML, this will allow us to use 3D Studio Max or Unigraphics to generate the geometries.

Each geometry node contains and index to a color table. The color is specified using its RGB value, as well as the alpha component. By altering the opacity of nodes making up the geometry, it is possible to create see-through sections. This feature could be used for instance to create a representation of a vacuum tank, with windows through which the user could look inside. Of course, the user will have the freedom to navigate inside the tank, but a model of the vacuum tank's shell can provide a more realistic experience.

A collection of glyphs can also be loaded into the visualization domain. Glyphs are simple geometric objects that are oriented along their vector data, and can also be scaled according their vector magnitude. Since the capVTE input dataset is made up of a collection of frames, animations of particle flow are very easy to implement using the glyphs. The glyphs can also be used to visualize vector quantities stored at the grid points. The picture on the right illustrates this feature. The glyphs are used to visualize the velocity distribution around the thruster exit.

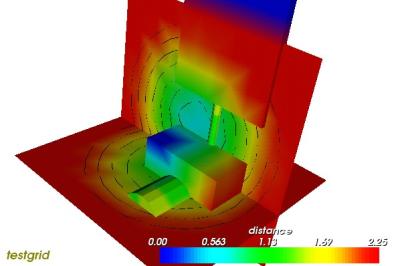
capVTE can also interpolate the grid data onto the geometry. The picture on the left shows how this feature could be used, however, the picture has no physical meaning. The dataset being visualized is just a simple 3D test case which is being used primarily to debug and test the code. When this feature is turned on, every geometry surface becomes a cutting plane. The correlation between the geometry scalar gradient and an actual cut through the data set can be seen from the picture. The resolution of the gradient is fairly poor, this is due to the limited number of nodes making up the geometry. If a finer geometry mesh were use, the correlation would be much smoother.

A big strength of capVTE is its support for animation. The glyph and grid data is loaded in as a collection of frames. The user can toggle playback and adjust the playback rate. The program automatically scales the update rate for the individual objects, so that, for instance, if the user defined only 2 grid frames, but 10 glyph frames, the program will show the first grid frame while the first 5 glyph frames are played back, and so on. The simple movie recording interface also exists.

capVTE can also be used to generate movies. When recording, capVTE will output a JPEG snapshot at a specified rate. This feature is illustrated by the movie on the right. The input dataset consisted of three objects - the satellite geometry, 8 frames of grid and 8 frames of glyph data. capVTE was used to take 8 snapshots, which were converted into a movie using Macromedia Flash MX in less than 5 minutes. Adobe Premier could also be used to generate a more portable movie file, however, using Premier is not recommended due to its poor performance (i.e. frequent crashes). The movie is further analyzed in the Analysis section.