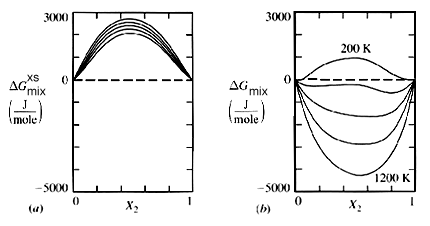
Figure 1. Free energy-compostion diagrams for a flexible three parameter solution model plotted as a function of temperature ("Thermodynamics in Material Science", Robert DeHoff, McGraw-Hill Inc. pg. 243).
Phase diagrams are the primary visualizing tools in materials science because they allow one to predict and interpret changes of a composition of a material from phase to phase. As a result, phase diagrams have been proven to provide an immense understanding of how a material forms microstructures within itself , thus leading to an understanding of its chemical and physical properties. However, there are instances when materials fail to perform to their proposed potential. One can deduce, referring to its phase diagram, what may have happened to the material when it was made, to cause failure. In these instances, one can use thermodynamic relations to go into the phase diagrams and extrapolate data which would not have been available to measure before. Thus, this thermodynamic erudition can lay a foundation to ascertaining the kinetics of processes that take place during phase diagram construction.
To lay this foundation, the tool that will prove to be most useful is the concept of equilibrium. Equilibrium is best described in terms of free energy. Free energy is a measure of a systems internal energy which gives an indication of the randomness or entropy of the system. The best way to use free energy to describe a phase diagram is to use a graph of free energy versus the composition (a G-X diagram) of a system.
For any given phase a G-X plot can be made holding temperature and pressure constant. Figure 1 illustrates such a plot for an ideal solution at many temperatures.

Figure 1. Free energy-compostion diagrams for a flexible three parameter solution model plotted as a function of temperature ("Thermodynamics in Material Science", Robert DeHoff, McGraw-Hill Inc. pg. 243).
Each of these curves is represented by the mathematical equation:
 (1)
(1) (2)
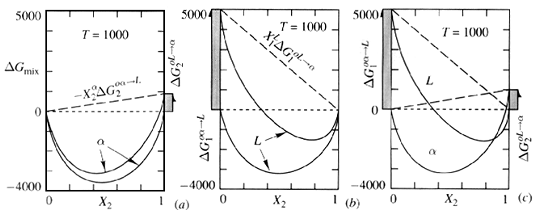
(2)where the excess free energy of mixing generally depends on composition, temperature, and pressure. Figure 2 illustrates how the excess free energy contributes to ideal free energy of mixing. Now that each phase that may exist in its system has its own G-X curve, phases may be compared. However, in order to compare G-X curves of different phases, the energies of each component in the system must be related to the same reference state.

Figure 2. Effect of change in refernece states of pure 1 and pure 2 upon the shape of the G-X diagram for (a) the solid solution, alpha, and (b) the liquid solution L. The comparison of mixing behavior in (c) is now valid because the reference states are consistent. ("Thermodynamics in Material Science", Robert DeHoff, McGraw-Hill Inc. pg. 246).
G-X curves that are constructed for each phase are derived from the mixing processes in which the solution was formed from pure components in some initial (and unmixed) condition. The reference state is this unmixed condition.
Since there is a G-X curve for each phase, there must be a reference state for each component in the system. Specification of any reference state requires that each component of the phase diagram at the beginning of the mixing process has four conditions:| -Pressure in the component = pressure in the solution |
| -Temperature in component = temperature in the solution |
| -Composition in component = that of a pure component |
| -Phase Form in component = phase form in the solution. |
So, for example, if one needs to describe an ideal liquid solution with components X and Y at a standard temperature and pressure, the reference state for X is pure liquid X at STP; the reference state for Y is pure liquid Y at STP. Similarly, in an ideal solid solution of X and Y, the reference states are pure solid X and Y respectively at STP. However, to relate solid solutions with liquid solutions to compare energies of mixing, these models are not enough.
To compare liquid and solid solutions, one must find a reference state that is the same for both of the solutions. To do this, it is required to change the reference states in the mixing calculations of one of the solutions. To change one of the reference states requires a knowledge of Gibbs free energies between the different reference states.
 (3)
(3) (4)
(4) are Gibbs free energies of any component in solution and in its pure form respectively.
Now, to compare the mixing behavior of the two solutions the reference states need to be the same. There is more than one way to accomplish this as one can see in this table:
| I | II | III | IV | ||||
| Ref. state for alpha solution | {alpha;alpha} | {alpha;L} | {L;alpha} | {L;L} | |||
| or | or | or | |||||
| Ref. state for liquid solution | {alpha;alpha} | {alpha;L} | {L;alpha} | {L;L} |
To illustrate how to change reference states, let us choose reference state labeled II. Looking at this state, we have to calculate the following equations:
 (5)
(5) (6)
(6)Notice that the  term in equation (3) has been replaced by
  in equation (5) and
  in equation (4) has been replaced by
  in equation (6) - this is done as specified by the reference states on the left side of the equality. The
  terms stay the same for the X and Y components which represent the a and L phases respectively. Now the energies of mixing can be compared.
To get these new solution models in terms of some explicit reference state, we need to reference them to equations (3) and (4) with their assumed reference states. When we do this, we get:


Finally, the Gibbs free energy of mixing can be expressed as:
 (7)
(7) (8)
(8)This derivation was based on only one of four possible choices for equivalent reference states. Any other choice would lead to different linear terms to the final expressions above. In general, the choice of reference states for the components determines the hanging points for the corresponding G-X curve.
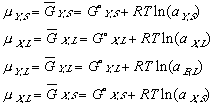
A change in reference states also alters the calculated values of the activity ,a, and its coefficients for various components in that solution. This makes sense because activity is defined as:

 (9)
(9) (10)
(10) (11)
(11)To keep the equations legible, terms such as XY,L refer to the composition (X) of component Y in the (L)iquid phase.
While trying to keep this as simple as possible, from now on we will assume that we are dealing with an ideal solution. In an ideal solution, we shall also assume that the activity of a component at any phase is equal to its composition at that juncture.

Applying now last equation along with (11) and (10); and keeping in mind that while the systems in the phase diagrams are in equilibrium, their free energy is at a minimum. In other words delta Gmix is zero. one can see:


In another effort to make the equations legible, Gibbs free energy of mixing from one phase to another, from its solid phase to liquid phase, a.k.a. free energy of melting will be denoted as delta G_,M for any _ component of the system.
Using these ideal models and solving for the composition we get the equation of the solidus line for the Y component at any temperature, T, can be found and is given as follows
 (12)
(12) (13)
(13)
where H is the enthalpy of a system and S is the familiar entropy. Enthalpy is a variable that takes into account the pressure and volume a system is at, an equation for gibbs free energy of any substance at some temperature, T, can be expressed as:
 (finale)
http://www.eng.vt.edu/eng/materials/classes/MSE2094_NoteBook/
96ClassProj/analytic/anmeth.html