ESM4714
Scientific Visual Data Analysis and Multimedia
Exercise #8: 3D Visualization of the Gas Law
NOTE: Highlighted italic text denotes user response.
Tensor equations are invariant to arbitrary transformations as are scalar
quantities such as temperature, density, pressure, etc. The Gas Law is a simple
scalar (zeroth order tensor) equation that relates pressure, density and
temperature independent of space and time. This invariance is not just a
mathematical property but is the essential requirement and concept of a law.
Because it is possible to visualize this invariance in 3D coordinate space and
time, it is then also possible to extract simple relationships such as the Gas
Law from numerical or experimental data sets.
The purpose of this exercise is to demonstrate that it possible to see this
invariance. We can then use this idea in reverse and demonstrate that it is
possible to extract simple relationships from raw experimental data or numerical
solutions. For a more complete explanation of this method refer to your class
notes "Three Visual Methods: Gradients, Function Extraction, and Tensor Glyphs"
Objective:
Visually demonstrate that it is possible to see the invariance of a simple scalar equation.
Procedure:
- Logon onto mercury -> pluto.smvc.vt.edu at the VT-CAVE classroom (SMVC).
- Mount your optical disk (see procedure for mounting scsi devices).
- Go to the ESM4714/examples directory.
- Locate the same density, temperature, and pressure files as you did in Exercise#7.
- viz?% cd
/optical/ESM4714/examples/ragab/viz_method/gas
- viz?% ls -lag will list the following files:
   D.file      This is the original density data
   P.file      This is the original pressure data
   T.file      This is the original temperature data
   fields      This is a directory containing AVS *.fld files
   networks    This is a directory containing AVS network files
- Start up AVS.
- viz?% avs
- Select 'Network Editor'.
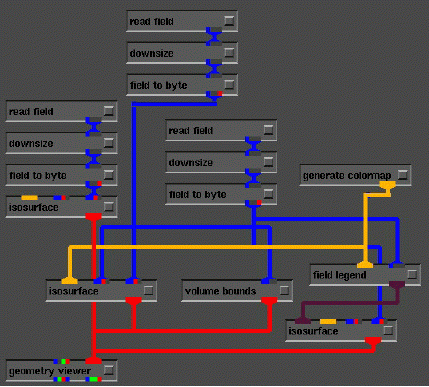
- Under 'AVS Network Editor' select 'Read Network' and then select the file
'par3.net' in the networks directory.
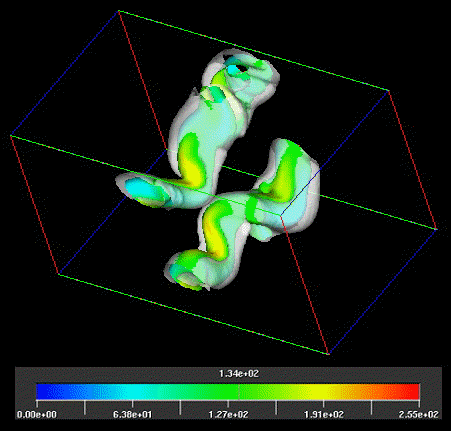
Wait for network to load, execute and generate and image in the X-window, and
then adjust isosurfaces until you create and image similar to the figure shown
below. Notice that the green color (temperature) mapped onto the pressure
isosurface exists everywhere that the pressure and density surfaces intersect.


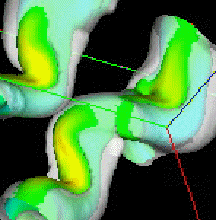
A closer expanded image of these intersecting surfaces shows how translucent
isosurfaces can enhance the observations of this invariance
 NOTE: These images that are automatically generated by the par3.net file will be very close to the images show above, but you may want to adjust the isosurfaces to experiment with the sensitivity of this invariance. You will find that a continuous color gradient is not ideal but you may want to try a different color scale to highlight the fact that the intersecting density and pressure surfaces always intersect at a location that shows a constant color band coinciding with the intersection.
.
 Click image to return to Visualization home page.
R.D. Kriz
Virginia Tech
College of Engineering
Revised 01/10/99
http://www.sv.vt.edu/classes/ESM4714/exercises/exer8/exer8.html


 NOTE: These images that are automatically generated by the par3.net file will be very close to the images show above, but you may want to adjust the isosurfaces to experiment with the sensitivity of this invariance. You will find that a continuous color gradient is not ideal but you may want to try a different color scale to highlight the fact that the intersecting density and pressure surfaces always intersect at a location that shows a constant color band coinciding with the intersection.
 Click image to return to Visualization home page.