
Running AVS
First, you should get the AVS configuration files as described on the main documentation page. Then you can run AVS by typing avs at the commandline. This will bring up the AVS startup window. Press the button labeled Network Editor to get the full AVS
user interface.
Press the button labeled Network Editor to get the full AVS
user interface.
The Elements of the AVS user
Interface
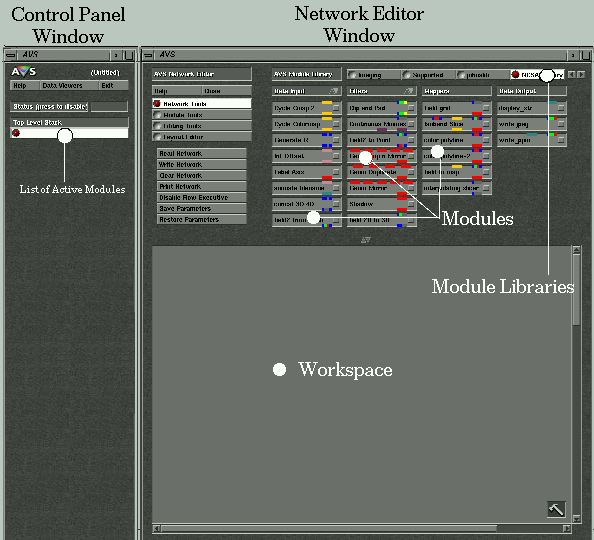
- The Network Editor Window
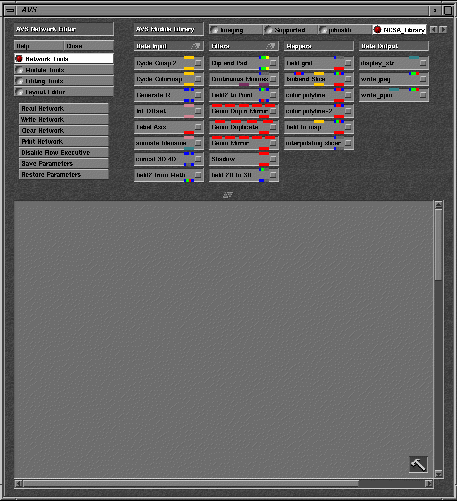
The top half of the Network Editor contains lists of "modules" that are availible in AVS. These modules are effectively subroutines-in-a-box.
The colored-boxes on the top of these modules represent the data inputs to the modules. The boxes at the output indicate the outputs of the module subroutine; the finished product of the modules computations. These colored-boxes are refered to as "ports". The ports are color coded to indicate the type of data they accept.
For example;

- Blue represents field data; raw data from your
simulations.
- Blue-Green-Red represents image data; RGB images.
It is a subtype of the field data type.

- Orange represents Unstructured Cell Data;
This is the format used to represent Finite Element data.
- Pink represents chemistry structures;
This format stores molecular structure and bonding information
as well as field data like monopole electric potential.

- Red represents geometry data; 3D graphical objects
produced from your data.
- Yellow represents colormaps (describes how to colorize
the graphics)
These modules are contained in different module libraries which are listed across the top of the window.
 You can select different module
libraries using by pressing on the radiobuttons with the module library
names. The arrows to the right of the module library radiobuttons scroll
the list of libraries laterally through the list of libraries (which is
too large to fit on a single window).
You can select different module
libraries using by pressing on the radiobuttons with the module library
names. The arrows to the right of the module library radiobuttons scroll
the list of libraries laterally through the list of libraries (which is
too large to fit on a single window).

Above each of the columns of modules is a small box with up and down arrows.
 You can scroll up and down through a list of modules pressing the left
and right mouse buttons there.
You can scroll up and down through a list of modules pressing the left
and right mouse buttons there.The module columns are generally divided into 4 categories. These categories are;
- Data Input:
- Modules that read datafile or automatically generate data.
- Filters:
- Modules that perform conversion operations on data like type conversion or image-processing operations.
- Mappers:
- Modules that convert data into graphical objects
- Data Output:
- Modules that write data, or render graphics.
- The Control Panels Window
-
Every
time you put another module onto the workspace of the Network Editor,
all of the user-interface widgets associated with that module appear
in the tall control panels window to the left of the network
editor. For example, if you get the isosurface from the
mappers category of the Supported module library, the
widgets for module will appear on the control panel.
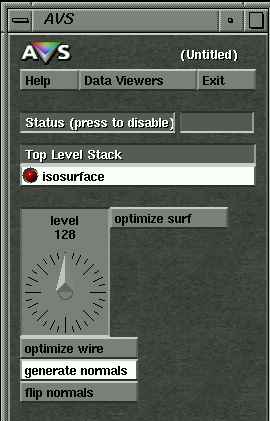
At the top of the window are a radio buttons which list all modules currently on the workspace. You can select different module control panels by clicking on these radiobuttons. Alternatively, you can select the control panel for a specific module by pressing the left mouse button on the small box on the right side of the module.
Creating a Network
Select the module library called Supported. Then get the following modules and place them on the desktop.-
(found under the heading "Input")
 (found under the heading "Ouput")
Connecting and Disconnecting Modules
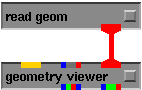
You can see clearly from the color-coding that the output of Read Geometry is of the same data type as the right-most input of Geometry Viewer. To connect these two ports together;- press the middle mouse button on the output port (the red box) at the bottom of the Read Geometry module. This will cause a thin red line to the Geometry Viewer module to appear. You have to get the mouse pointer exactly inside of the red box for this to work.
- Move the mouse pointer towards the Geometry Viewer module until the line gets highlighted in white.
- Release the mouse button to complete the connection.
Disconnecting the two modules is similar to connecting them except you use the right mouse button.
- press the right mouse button on either one of the ports. This will cause all lines connected to that port to be highlighted with a thin white line.
- Move the mouse pointer towards the other side of the port you want to disconnect until the line between the two ports is highlighted with a thicker white line.
- Release the mouse button to complete the disconnection
- Now reconnect the two modules. At this point your network should
look like this;
- Select the control panel for the read geom module by
either
- Pressing the left mouse button on box on the right side of the
module
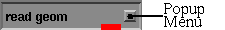
- Pressing on the radiobox titled Read Geom Control
Panel window.
- Pressing the left mouse button on box on the right side of the
module
- The read geom control panel should be apparent in the Control Panel Window on the upper left side of the screen.
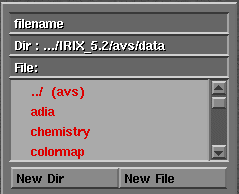
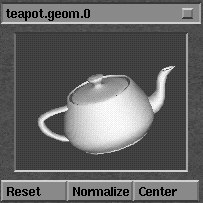
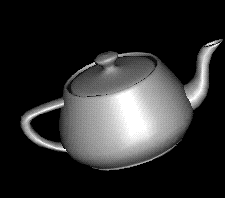
The text highlighted in red represents a directory whereas black text represents a file. You can navigate through directory structures by simply clicking on the directory name.You should scroll down this list to find a directory called geometry. Select that directory and then select a file in that directory called teapot.geom.
- Selecting the teapot.geom causes the read geom
module to read in a new geometrical object and display it in the
geometry viewer window.
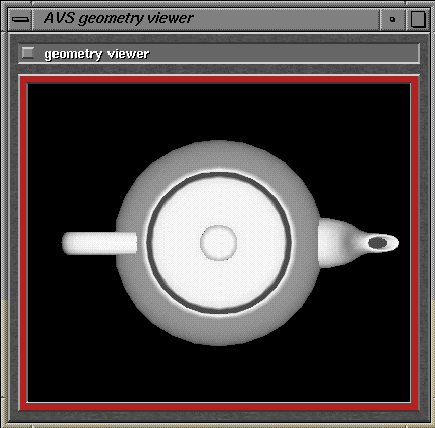
To rotate the teapot, grab it using the middle mouse button
To scale the teapot, press down the shift key while holding the middle mouse button.
To translate the teapot, use the right mouse button.
- You can also change the way the object is rendered using the
controls on the Geometry Viewer menu. You can get to the
Geometry Viewer menu by either
- Pressing the left mouse button on box on the right side of the module
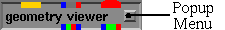
- Pressing on the popup menu labledData Viewers at the top of
theControl Panel window and pulling down to the choice
Geometry Viewer.
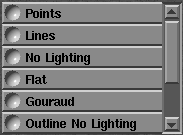
The default rendering method is Gouraud. You can change the rendering method by selecting the object you want to render differently (the teapot) and then selecting a new render method from this menu. Select the teapot using the left mouse button. The name of the currently selected object appears at the top of the geometry viewer's thumbprint view of the scene.
 .
.
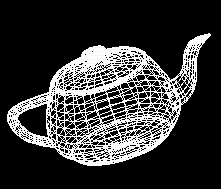
Then change the rendering method to lines using the menu at the bottom of the geometry viewer control panel.
You can change it back to its default rendering method by selecting Inherit from the rendering menu.
- Pressing the left mouse button on box on the right side of the module
- The material properties of the rendered surfaces can be changed
using the
 button located
roughly in the middle of the geometry viewer control panel. With the
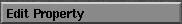
teapot already selected, press this button and you will get the
property editor panel.
button located
roughly in the middle of the geometry viewer control panel. With the
teapot already selected, press this button and you will get the
property editor panel.
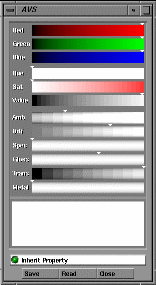
You can use this panel to change everything from the color of the object to its transparency. Often you will want to use it to make surfaces appear shinier, giving them more depth. This is accomplished by setting the ambient lighting (amb) to 0, and increaseing the specular reflectivity (spec) to 80-90% of maximum. This gives the objects a shinier appearence that highlights surface deformations.
Read more about creating useful AVS Networks