ESM4714
Scientific Visual Data Analysis and Multimedia
Exercise #5:
Using NCSA tools on the UNIX workstation
NOTE: Highlighted italic text denotes user response.
Objective:
Learn how to use the two most common NCSA X-Window visualization software
applications on the UNIX workstation: xds (X-DataSlice) and ximage(X-Image).
Note because X-Image is very similar to X-DataSlice we focus most of our
explanation on X-DataSlice.
Procedure:
- Start X-DataSlice.
- planet% xds
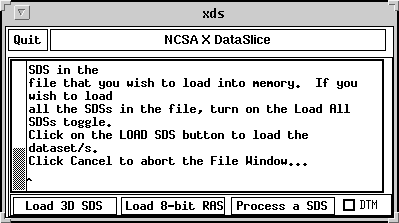
- Load 3D SDS file by selecting 'Load 3D SDS'.
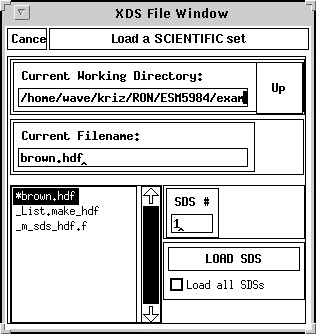
- Load the brown.hdf sds file by selecting 'LOAD SDS' (resulting image is shown below)
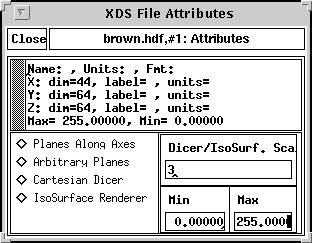
- When the HDF SDS file has been loaded another menu appears where you can
choose between Planes, Arbitrary Planes, Dicer, or Isosurface features. We
encourage you to try out each of these features but here we only show you Planes
and Dicer features.
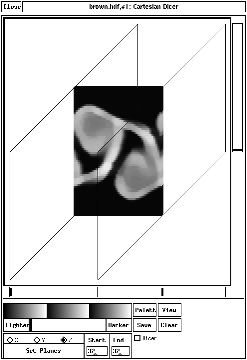
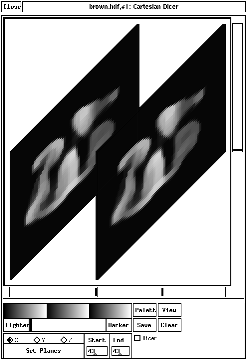
Select 'Cartesian Dicer' and view orthogonal planes
Different planes reveal different information. Experiment with these features.
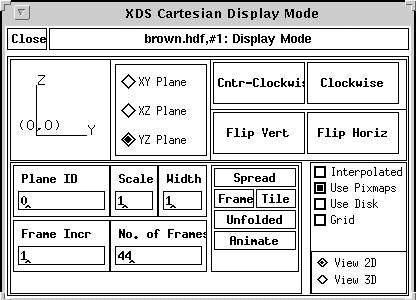
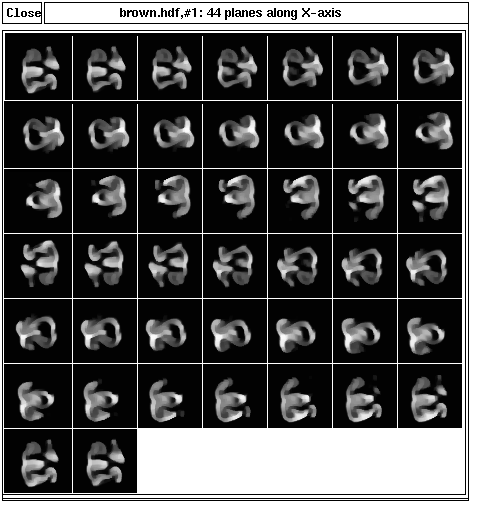
- If you choose 'Planes Along Axes' you can generate a "small multiple" (Tufte:
Envisioning Information) of postage stamp images along any axes by choosing
'Tile' or you can generate an animation of the same images along that axes by
choosing 'Animate'.
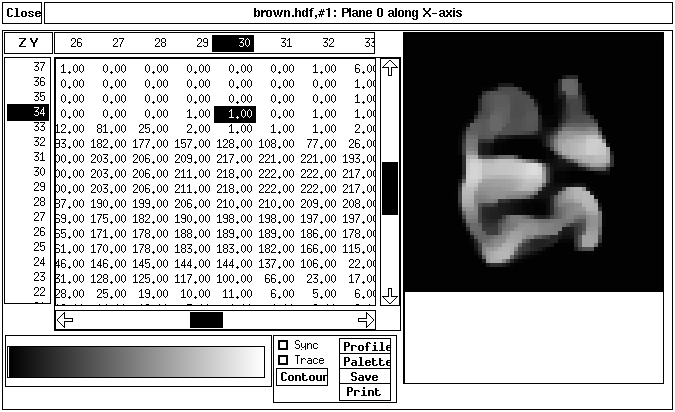
Perhaps the most useful feature in comparing quantitative numbers in a spread
sheet with a qualitative tv-grayscaled image is possible by choosing 'Spread'
where you can select either a number in the table or a pixel in the image and
then make a comparison between quantitative and qualitative formats. Tufte in
his first book "Visual Display of Quantitative Information" points out how tables
of numbers and graphs are complementary.
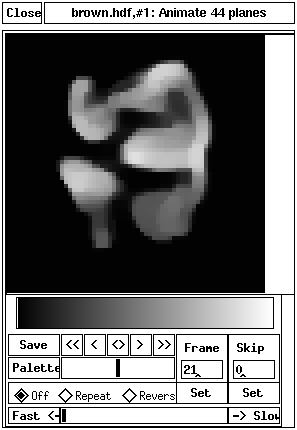
- If you choose 'Animate' xds will generate the window shown below and then you
can experiment with this tool by using different color palletes and controlling
the animation speed. The trend is that smaller images play faster but have less
information. This creates a tradeoff that you as a user should be aware of when
investigating your data for new information.
 Click image to return to Visualization home page.
R.D. Kriz
Virginia Tech
College of Engineering
Revised 01/10/03
http://www.sv.vt.edu/classes/ESM4714/exercises/exer5/exer5.html


 Click image to return to Visualization home page.