ESM4714
Scientific Visual Data Analysis and Multimedia
Exercise #14:
Comparing Physical Properties by Overlaying Information
There are numerous examples where researchers have learned more about possible
relationships between two different properties when this information is mapped
into a single "comparative" image. One example is "overlaying" information into
a single image. This can be done several different ways. In this execise we
will show you how to construtct two different types of overlays": 1.
superposition of contours on color gradients (2D-image) and 2. mapping color
gradients onto raised surfaces (2D-surfaces).
NOTE: These PV-Wave procedures require knowledge of manipulating system
variables. These and other PV-Wave commands are advanced topics for the
experienced programmer. Notice that the size of the PV-Wave procedure files
are still relatively small compared to other graphical programming languages.
NOTE: Highlighted italic text denotes user response.
Objective:
To show how to create an overlay of contours with 2D-images and map color
gradients onto raised surfaces.
Procedure #1:
Overlaying contours onto 2D-images
- Logon onto mercury -> pluto.smvc.vt.edu at the VT-CAVE classroom (SMVC).
- Mount your optical disk (see procedure for mounting scsi devices).
- Go to the ESM4714/examples directory.
- Locate the directory that contains PV-Wave procedure files for generating an
image where density and vorticity are the two data sets that will be overlayed
and then start wave.
- viz?% cd /opdisk/examples/ragab/overlay
- viz?% ls -lag
- viz?% wave
- wave>_
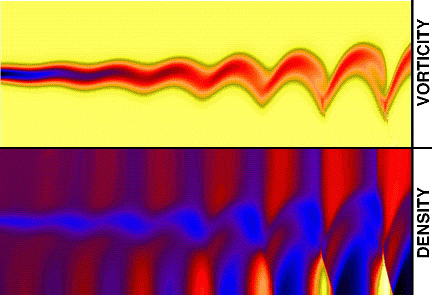
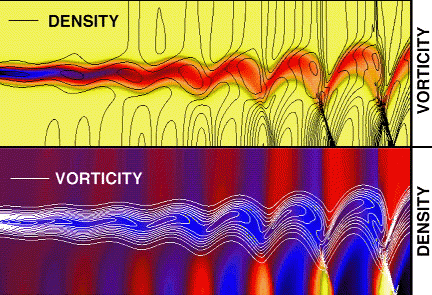
- Execute the makeoverlay procedure file and create two images: 1. overlay
contours of density on a color gradient of vorticity and 2. overlay contours of
vorticity on a color gradient of density.
NOTE: you might want to try the other PV-Wave overlay procedures in the same directory.
- wave> makeoverlay
The resulting overlayed images are shown below. Note that the shock wave
eminating from a mixing instability can be seen more clearly by contours of
density superimposed on the gradient of vorticity. This suggests that the
vorticity could be continuous across a shock wave?
Procedure #2:
Mapping color gradients onto 2D-surfaces
- Locate the Advanced Rendering Library (arl) directory that contains PV-Wave procedure files for generating a topological image of Boulder Colorado and then start wave.
- viz?% cd /opdisk/arl/examples
- viz?% ls -lag
- viz?% wave
- wave>_
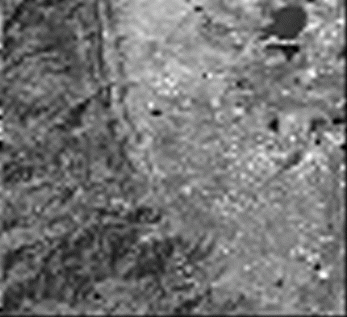
- Execute he boulder_map.pro PV-Wave procedure file, which overlays a 2D image file from the LandSat satellite (boulder_gray.img) onto a raised surface image of 2D data taken from U.S Geological Survey (boulder_elev.dat), both files are binary arrays.
Satellite image:
USGS tolopolgical data:
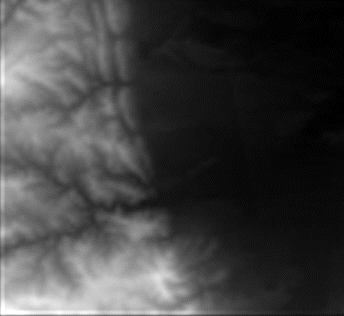
- wave> boulder_map
NOTE: When these two data sets are combined as shown below the viewer gets a prespective of the mountains with the same shading at the time of day the satellite image was taken. It is not possible to deduce aprior the subtle effect that will result from overlaying these two data sets. It is now possible to "fly" around the 3D image that has been created by these two 2D-data-sets. An unexpected synergism results when two data sets are overlayed and we artifically create a virtual environment similar to flying an airplane. I personally selected the parameters ax=-70, ay=0 and az=-80 which is the view I have often seen in a my sailplane on a good soaring day, flying over Boulder. Please excuse my nostalgia.
Overlaying satellite image data on surface of topological data.
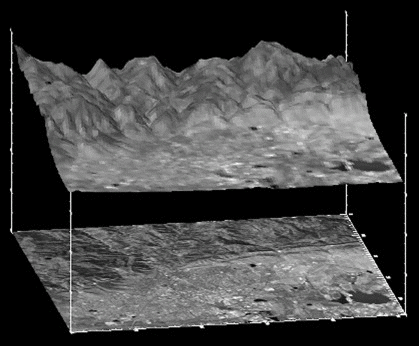
Before the satellite image data is mapped onto the raised surface topology, this 2D image is also shown as a 2D image in the plane below.
 Click image to return to Visualization home page.
R.D. Kriz
Virginia Tech
College of Engineering
Revised 01/10/99
http://www.sv.vt.edu/classes/ESM4714/exercises/exer14/exer14.html