- viz?% cd /opdisk/examples/color/lorenz
- viz?% ls -lag
- viz?% wave
- wave>_
- viz?% ls -lag
- viz?% itoa.x < ranibow.pal > mac_rainbow.ascii
- viz?% wave
- wave> device,pseudo_color=8 (Note: Setup for Sparc20s in Viz lab)
- Depending on your particular graphics hardware configuration, other or
different devices
may need to be declared before proceeding. Consult PV-Wave documentation Appendix
on "Output Devices and Window Systems". To determine your particular graphcis
configuration, at the wave prompt enter: wave> info,/device
- wave> adj_ct_mactosun,240
- **** Read-in Mac color-map filname ****
- : mac_rainbow.ascii
- **** Write-out Sun color-map filename ****
- : sun_240_rainbow.ascii
- viz?% wave
- wave> l_color,240
- **** Enter file name for color map to be loaded ****
- :sun_240_rainbow.ascii
- wave> palette
- The PV-Wave command palette generates an interactive color
palette shown below, where
the Red, Green, and Blue intensities can be manipulated with the left mouse button. Two
colors at the end of the color spectrum are set to "255" (white) and "0" (black) and are
reserved for plotting grid lines, coordinate axes, and background in the PV-Wave procedure
files m_bar.pro and m_lorenz.pro. These two reserved colors are not part of the rainbow
color palette that is used by m_lorenz.pro to plot time as color.Although these end colors can be set with the PV-Wave procedure file palette, in this example
the white and black colors were originally set in the color palette mac_rainbow.ascii, where
256 pixels (0-255) were used to define the Red, Green, and Blue color palette. The PV-Wave
procedure file adj_ct_mactosun.pro rescaled the 256 (0-255) colors in the mac_rainbow.ascii
color palette to 240 (0-239) colors in the sun_240_rainbow.ascii color palette.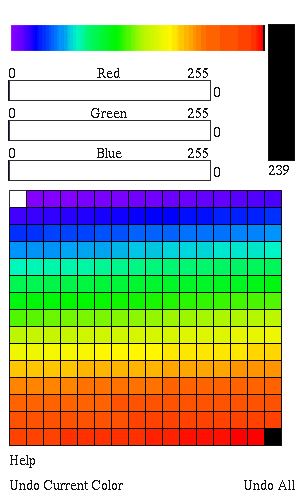
- **** Enter file name for color map to be loaded ****
- wave> m_bar,240,0,239
- **** Enter filename for color map to be loaded ****
- : sun_240_rainbow.ascii (where pixel-0=white ["256"] and pixel-239=black ["0"])
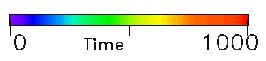
- **** Enter filename for color map to be loaded ****
pixel-0=white (background) and pixel-239=black (axes).
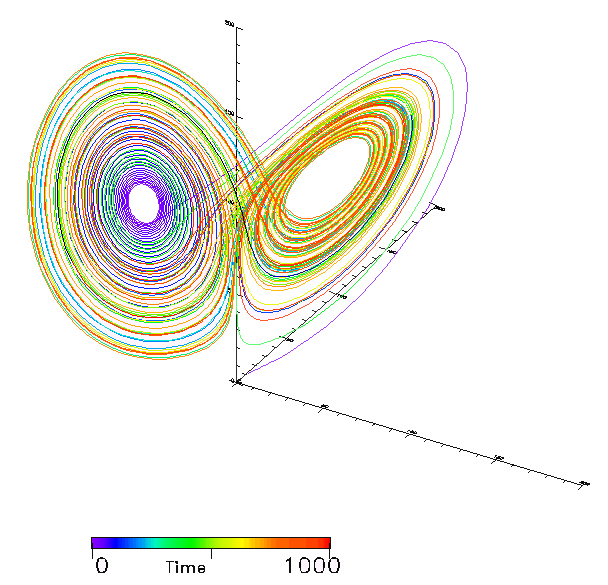
- wave> m_lorenz,240,0,239
- **** enter filename for color map to be loaded ****
- : sun_240_rainbow.ascii
- **** enter filename for color map to be loaded ****
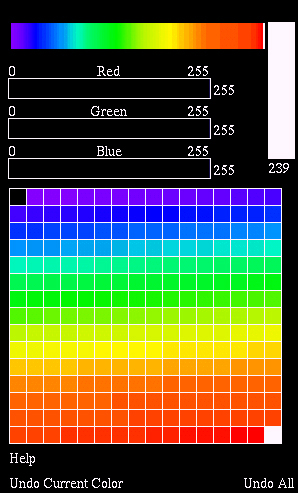
- wave> m_color,240
- **** Enter file name for altered color map ****
- : sun_240_mod_rainbow.ascii
- **** Use existing color / Choose new color (0/1) ****
- : 0 (an adjustable color palette appears, see above image)
- Change the 0-th pixel from white to black and the 239-th pixel from black to white.
- The Lorenz attractor image, shown above with a white background, is modified and shown below.
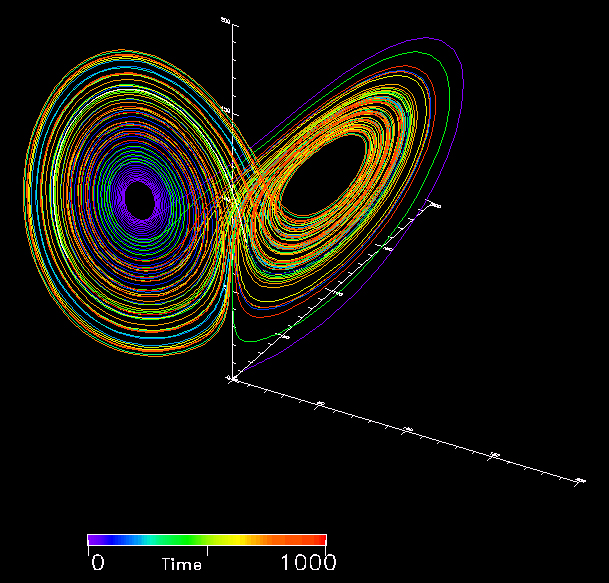
- Note that this change in background and axis line colors did not effect the colors on the Lorenz
attractor. The m_lorenz.pro PV-Wave procedure file is constructed so that the end colors on
the rainbow color palette are reserved for the background and axis line colors and the rainbow
colors are reserved for plotting time on the attractor plot. This is an example of how a special
color palette can be constructed so that different portions of the color palette can be used for
different purposes. - **** Enter file name for altered color map ****