STUDY INTO MINIMAL SURFACES IN A 3-D SETTING
BY: KEVIN DENT CO-AUTHOR: SANJIV PARIKH
OBJECTIVE:
This project is designed to enhance the visual detection of minimal surface on crystalline structures through the aid of VRML.
INTRODUCTION:
The study of minimal surfaces arose naturally in the development of the calculus of variations. The link between curvature and minimal surfaces was made by Meusnier, in 1776, which he proved:
For a minimal surface, the principal curvature is equal,
and the sign is opposite at every point. The Gaussian
curvature is then always non-positive, and the mean
curvature is zero.
A minimal surface can be represented (locally) by a set of three integrals. They represent the inverse of a mapping from the minimal surface to a Reimann surface. The mapping is a composite one; first the minimal surface is mapped onto the unit sphere, the sphere itself is mapped onto the complex plane by stereographic projection. Under these operations, the minimal surface is transformed into a multi-sheeted covering of the complex plane. Any point on the minimal surface is described by the complex number
w, which defines its mapped location in the complex plane. The value of w is dependent only on the surface orientation of (x,y,z). The Weierstrass equations allow calculation of the cartesian coorinates ((x,y,z) with respect to an origin (x0,y0,z0)) of the minimal surface at all points on the surface – except flat points – in terms of complex analytic function R(w). The Weierstrass equations are:R(
w) = 1/(˜ (1 – 14w4 + w8))X = x0 + Re⁄ eiQ(1 – w2) R(w)dw where the integral is from w0 to w1 and Re is the real
part of the answer;
Y = y0 + Im ⁄ eiQ(1 – w2) R(w)dw where the integral is from w0 to w1 and Im is the
imagery part of the answer;
Z = z0 – Re ⁄ eiQ(2w) R(w)dw where the integral is from w0 to w1 and Re is the real
part of the answer.
Once we have these x,y,z points we can graph the surface of the structure. At this point, the aim of these project could benefit science. Normally graphing the structure of the surface yields a two dimensional graph with no other conclusion inside of the graph. But, through VRML we are able to graph a 3-D model of the structures’ surface, graph color onto of the surface, and able to manipulate the surface in a 3-D virtual reality environment. Using a color grid, from 0 to 1 corresponding to color, we are able to find each points’ curvature and assign it a color. So we are able to find the curvature equaling to zero quicker, therefore find a minimal surface with less time.
From Dr. Ron Kriz’s Scientific Visualization and Data Anaylsis/Multimedia, I received training in understanding the properties of viewing data. It is important to understand the limitations of the tool the audience will be using to view the data.
PROCEDURE:
We began our project with a data set generated by Lesa Beverly, math ph.D candidate, program which used the equations form above to generated 10 to 15 thousand random x,y,z points. We were able to graph the points in VRML but because of the randomness of the points we were not able to create a surface. This image is the VRML file for the first data set. If you don't have a VRML plug-in, there is a link, to download one, later in the paper.
A surface in, VRML, is created by the connection of points of create some type of polygon. We tried to us a triangle or square. We had no idea what point would connect to what point. We proceeded to construct a closest neighbor program to find the nearest neighbor to each point and connect that point to the point in question. This program was used in other universities, Brown and Cornell, but their program would not fit our data set. Therefore, we need to create our own program or change theirs to fit our data set. After weeks of no results, we conclude the amount of computing time for each point in our data set would be a ridiculious amount of computing time, so we abandoned this method of making the surface.
The next idea, created by Dr. Boisen, VA Tech professor, was creating a sphere and then expanding the point onto the surface of the structure in question. After making the sphere surface, it would be possible to sliding the points and their connection onto the surface of the structure only if the structure was similar to a sphere.
The construction of the sphere seemed a challenge, also. We used sphereical coorinates to define the sphere. The idea was to tip rho the value of epsilon, which would be the value of phi, from 0 R to 2p R, making the first point on many different rings that make up the form of the sphere. The theta value would be calculated from the number of points to be equally distributed on the ring; theta would be the space in between the points on the ring. The equations of the programs were:
Number of Rings = p/epsilon
Phi = p/(number of rings)
Radius of the ring from the Z-axis = sin(phi)
Number of points on the ring = (2*radius*p)/epsilon
Theta increment = 2*p/(number of points on circle).
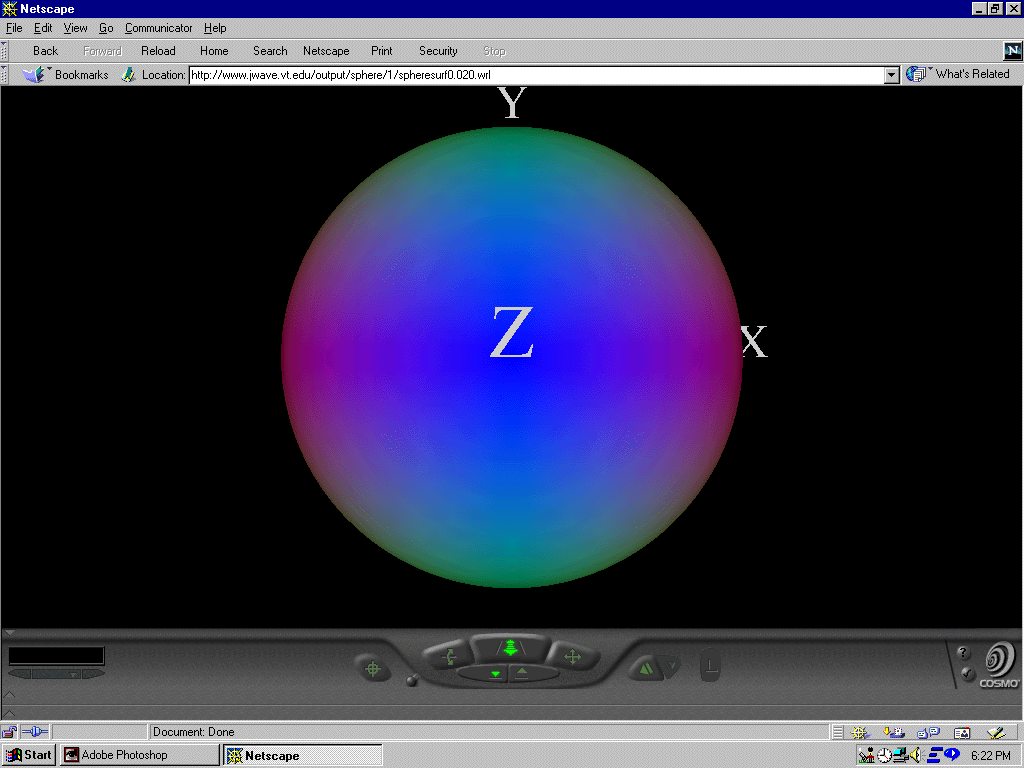
Then switching the points to the cartesian coorinates, we used the standard calculus equations. This program would generate the points on the sphere and then we could use Sanjiv Parikh’s program to connect and make a surface out of the points. We also created a web file form to create the sphere with different epsilon values. All this was an experiment within itself. Below are some snapshot of the spheres on the VRML player.

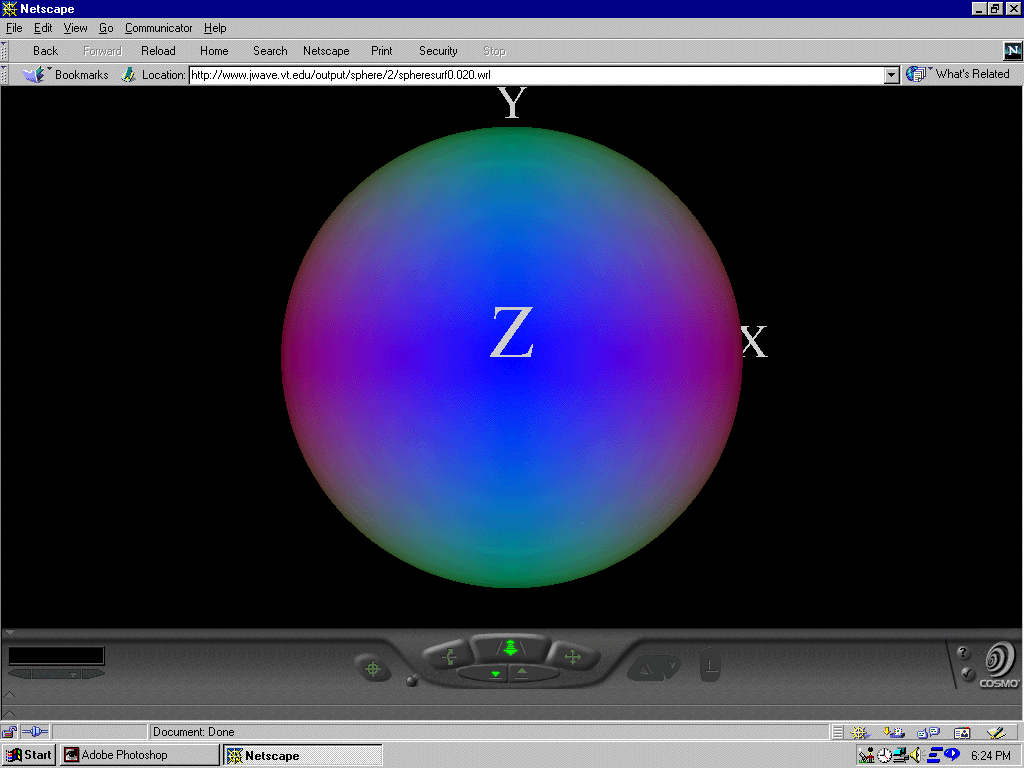
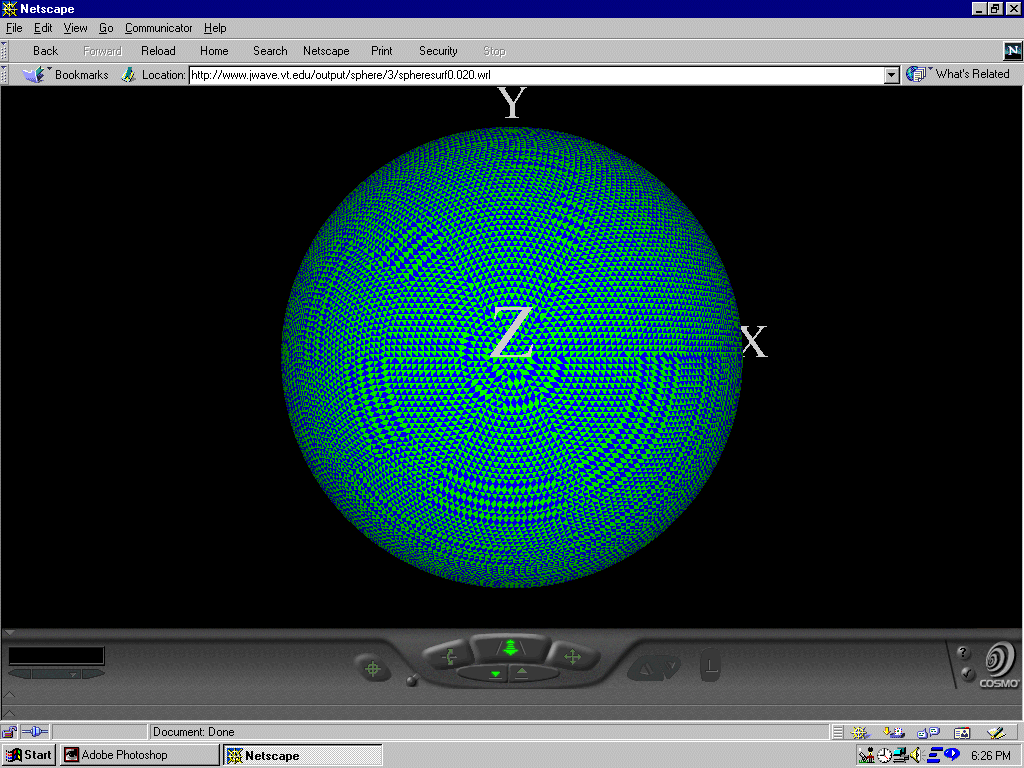
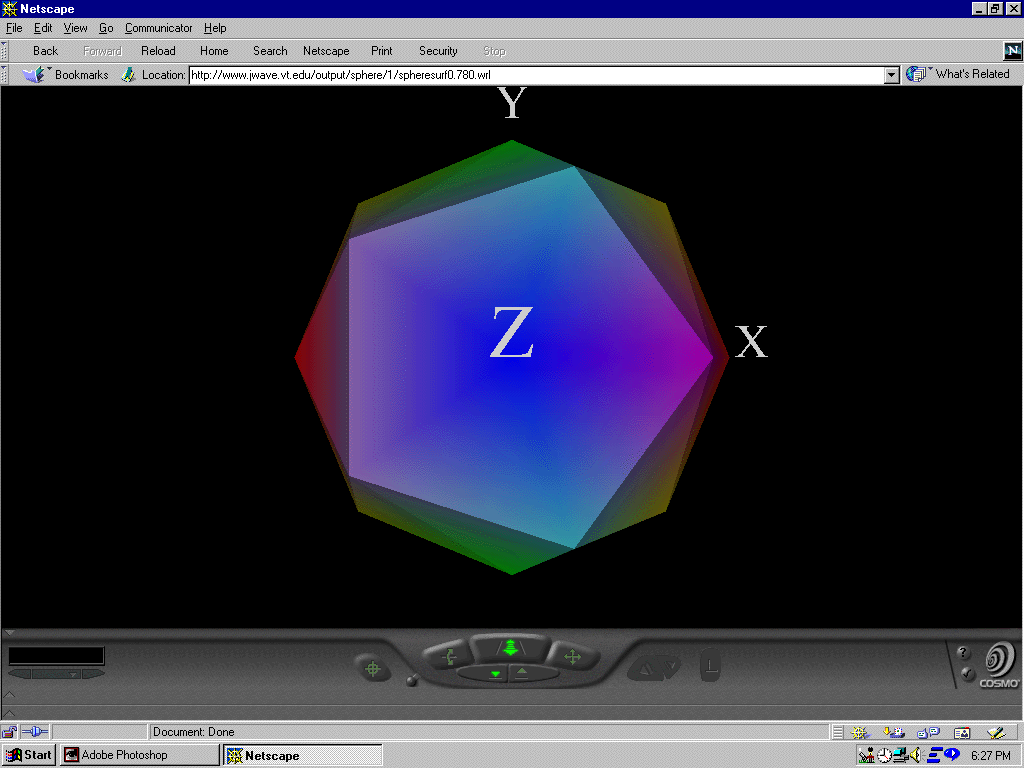
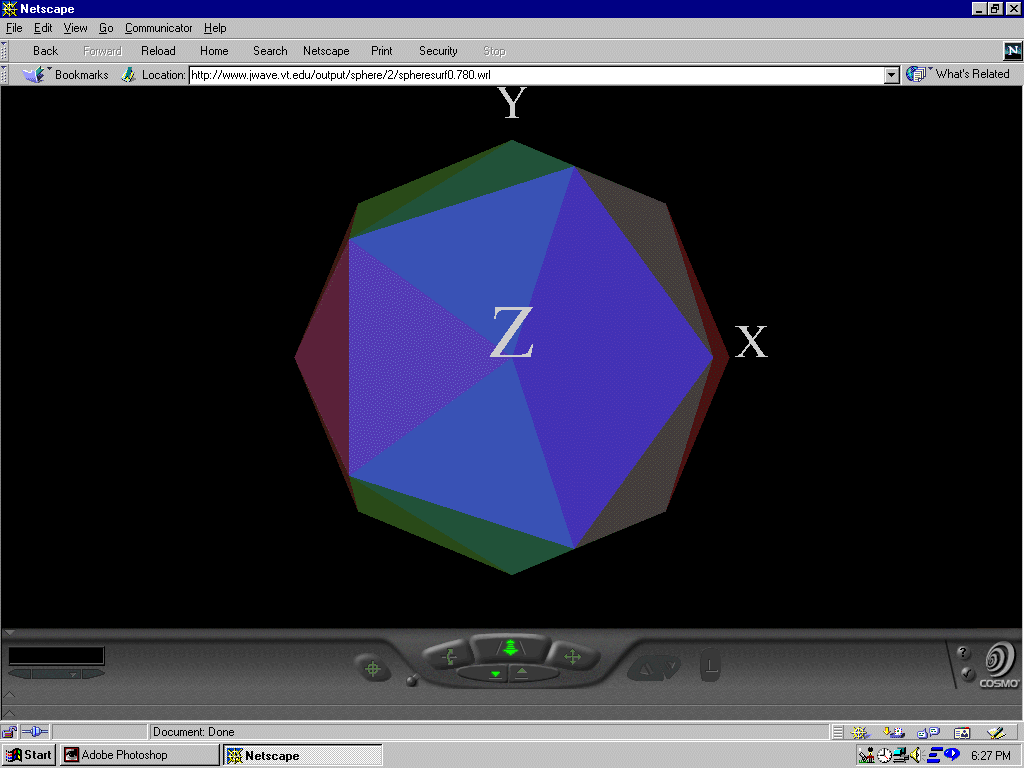
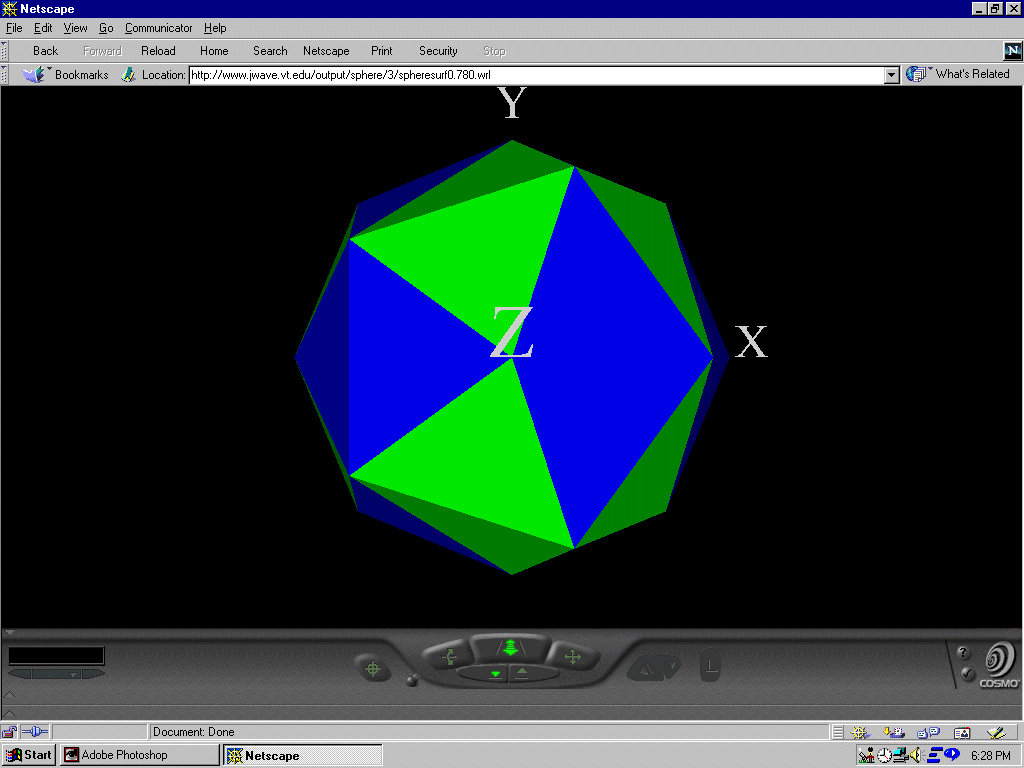
We was able to creat a web form that would creat a sphere of every imaginable epsilon, from .02 to .78. This file form is found here. Enter in your choosen epsilon and email address and it will send you a message, via email, as to where to find your results. If you don't want to use this form a batch of VRML files have already been done and ready fro you to view them on a VRML player. If you don't have a VRML player and are running on a PC platform, then click here to download the player. The files were done by setting epsilon from .02, increasing by .01, to .78. They can be found here.
The three directories have the same files but a little different. Directory one holds sphere files with continous color, given by the z component. Directory two holds sphere files that let the color of the surface of the triangle be define by the average of the each of the three point's z component. So each triangle that makes up the sphere has one solid color on it. Here is a movie with these spheres. Directory three has only blue and yellow alternating colored triangles, that make up the sphere's surface. This was used to notice that we have a smooth sphere, but the individual triangles make up the sphere. Here is a movie with these spheres.
We are now in the final stages of the project, seeing if we can expand our sphere onto the crystalling structure, but we have not completed this stage.
CONCLUSION:
Because the project is not finished, our conclusion is incomplete. But the valuable experience gained by the co-author, Kevin Dent, working with Dr. Kriz, and Sanjiv Parikh, and the virtual reality environment will aid me in all other research.
THANK YOU FOR ALL YOUR HELP SANJIV PARIKH, CO-AUTHOR, DR. RON KRIZ AND DR. MONTE BOISEN, PROFESSORS AND ADVISORS, AND LESA BEVERLY, PH.D CANDIDATE ( I KNOW YOU WILL GET IT AND GOD WILL SHINE ON YOUR SON).